 OGReNet Lesson Recipes
The Incredible Moving Volcano!
Mantle Hot Spots
written by:
Heather Gingerich,
Department of Earth Sciences, The University of Western Ontario
Designation: Ontario Curriculum: Science and Technology
Earth and Space Systems: Grade 7 The Earths Crust
Specific Expectations Addressed:
Understanding Basic Concepts - explain the causes of some natural events that occur on or near the earths surface (e.g., earthquakes, volcanic eruptions, landslides) and their effects.
Developing Skills of Inquiry, Design, and Communication compile qualitative and quantitative data gathered through investigation in order to record and present results, using diagrams, flow charts, frequency tables, bar graphs, line graphs, and stem and leaf plots produced by hand or with a computer.
Relating Science and Technology to the World Outside School identify past and presentday applications of technologies that have contributed to the study of geology (e.g., surface observation, core sampling, seismography, magnetometry, satellite technologies).
Background:
Volcanoes are places where magma rises to the surface from inside the earth. Why and where volcanic eruptions occur is best explained using the theory of Plate Tectonics. You may want to briefly review the Plate Tectonics module at this point. Remember that tectonic plates are really just solid pieces of the earths crust (the uppermost part of the lithosphere) that float around like rafts on the molten, more liquid-like sea of magma, also known as the asthenosphere. Volcanoes only occur in three specialized tectonic environments, they are;
1. Spreading Centres: where plate tectonics pull the earths crust apart, allowing magma to rise to the surface. These quiet eruptions are responsible for the formation of new crust. Only about 15% of active volcanoes occur at these divergent boundaries between tectonic plates. An example of a spreading centre type of volcano that influences Canada is the undersea Juan de Fuca ridge west of Vancouver Island.
2. Subduction Zones: where the edges of two tectonic plates collide and one, usually the more dense one, is forced beneath the other. The crust of the bottom plate melts and rises to the surface somewhere inside the edge of the top plate as molten rock, forming a volcano. These are typically explosive types of volcanoes because of the relatively great amount of SiO2, which is essentially sand, in the magma that comes from recycled crust. They account for approximately 80% of eruptions world-wide and generally cause the most damage. The Rocky Mountain Range on the West Coast of Canada, with its numerous volcanoes, is the result of subduction of the more dense Pacific Plate (oceanic plate) under the North American Plate (continental plate). Oceanic plates tend to be more dense than continental plates primarily because of the weight of the overlying body of water.
3. Mantle Hot Spots: where magma burns a hole through the crust in the middle of a tectonic plate. While this type of volcano may occur in the middle of continental crust, the best and most abundant examples of hot spots are to be found in the middle of oceanic plates. Because this magma is not recently recycled crustal material, it tends to be lower in SiO2 content, producing the quiet type of volcanic eruption that is characterized by gentle lava flows of black basalt. The closest we have to an example of a mantle hot spot in Canada is the Kodiak-Bowie chain just west of the Queen Charlotte Islands in British Columbia.
The interesting, and often confusing, thing about hot spot volcanoes is that they appear to move, while the other types of volcanoes are clearly stationary (and its a good thing, too!). Again, this is because of plate tectonics. As a plate slowly (i.e. at a rate of cms/year) passes above the mantle hot spot, the plume of magma melts into it, creating a chain of volcanic islands and/or seamounts (a.k.a. volcanoes that failed to break the surface of the water). Earth scientists are able to determine the velocity and direction of tectonic plate motion by correlating the age of islands and seamounts in a chain (as determined by core sampling and radiometric dating) with their position relative to that of the mantle hot spot (as determined by satellite imaging, underwater photography and videography, etc.). This kind of information tells us a lot about the velocity and direction of plate tectonics over time.
Materials Needed For Activity:
For teacher demonstration:
Overhead projector
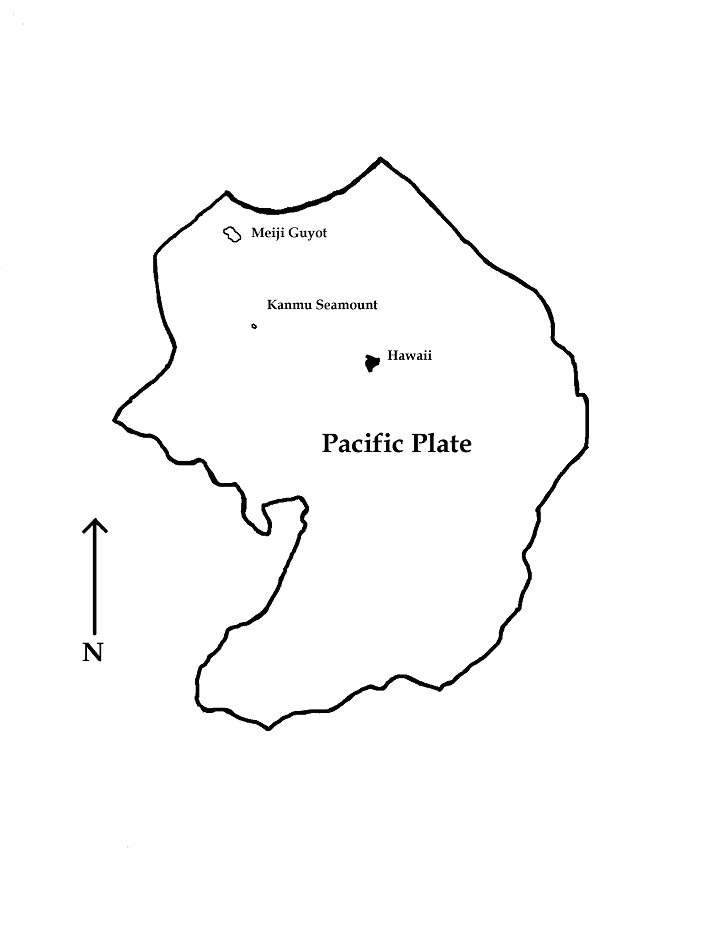
1 overhead transparency with outline of Pacific Plate photocopied, compass direction indicated
1 tea light candle with aluminum holder
Matches or lighter
1 sheet opaque paper with a ¼ hole punched in the middle (optional)
For student activity:
1 sheet of regular graph paper for each student or group
1 map of Hawaii-Emperor Volcanic Islands (provided) for each student or group
1 Age vs. Location table (provided) for each student or group
1 sheet opaque paper with a ¼ hole punched in the middle per student or group
A couple pieces of tape
Pencils, rulers, calculator (optional), etc. for graphing and simple calculations
Procedure:
To look at a topographic map of the Hawaiian Islands chain, it would appear as if the Pacific Plate were initially moving South and then Southeast. Not so! Place the lit tea light in the middle of the overhead projector. This is your mantle hot spot it does not move. Now hold the overhead transparency with the Pacific Plate photocopied over the flame where Meiji Guyot is indicated. Allow the flame to burn or melt a small spot into the overhead. There will be some smoke and the smell may not be pleasant. Open a window and inform your principal that you will be doing a controlled burn so that you dont cause too much of a commotion. Now move the overhead away from you or to the North according to your compass heading on the overhead. It may help you to position yourself so that you are facing roughly North in the classroom. Proceed in this direction, pausing to create little burn holes along the way, until you come to Kanmu Seamount on the overhead. Now change direction of plate movement to the Northwest, headed in the direction of Hawaii on your overhead. Stop when you reach Hawaii. You have now recreated the Hawaiian-Emperor Volcanic Islands. Your students can repeat this exercise without burning anything by using their map of the Hawaiian-Emperor Volcanic Islands as the Pacific Plate and a piece of opaque paper taped to the overhead projector or window as the mantle hot spot.
Now have the students graph the Age of the Island/Seamount (Millions of Years) versus the Distance (in Kilometers) from Hawaii Along the Chain. Use the following questions to generate discussion.
1. Under which island/seamount is the mantle hot spot located today? How about 2.5 million years ago and 2.5 million years from now?
2. Look at the shape of the Hawaiian-Emperor Volcanic Islands chain. What does its shape tell you about the direction of Pacific Plate Movement? Has the Pacific Plate always been traveling in the same direction throughout geologic time? When did it change direction?
3. Using your table and graph, calculate the velocity and direction of Pacific Plate motion for the Hawaii-Midway and Kanmu-Meiji sections of the chain. Remember to do the appropriate conversions (e.g., kilometers per millions years to centimeters per year). What does the individual slope (use a line of best fit) of these two sections on your graph represent? Has the velocity of Pacific Plate motion remained constant over geologic time? Do plate tectonics in general appear to be speeding up or slowing down? How might this affect all types of volcanic activity?
4. Where would you expect to find increased volcanic activity? What kind of activity would you predict? What might this mean for humans living in these areas? Is there anything we can do to stop plate tectonics?
5. A significant portion of the Hawaiian-Emperor Volcanic Islands chain is presently deep under water. How might earth scientists have used the technology of both the past and present to collect data on these old mantle hot spots?
Observations:
While there is likely nothing humans can do to alter plate tectonics, we can use the data generated through the study of mantle hot spots to make wise decisions about certain aspects of human behavior (e.g., where we choose to build our settlements, locate our nuclear power plants, etc.). You may now have a better understanding of why the subducting margins of the Pacific Plate are collectively referred to as the Ring of Fire, but why we continue to behave the way we do in spite of this knowledge is still largely a mystery.
Map: Hawaii-Emperor Volcanic Islands
Click on image for full sized map
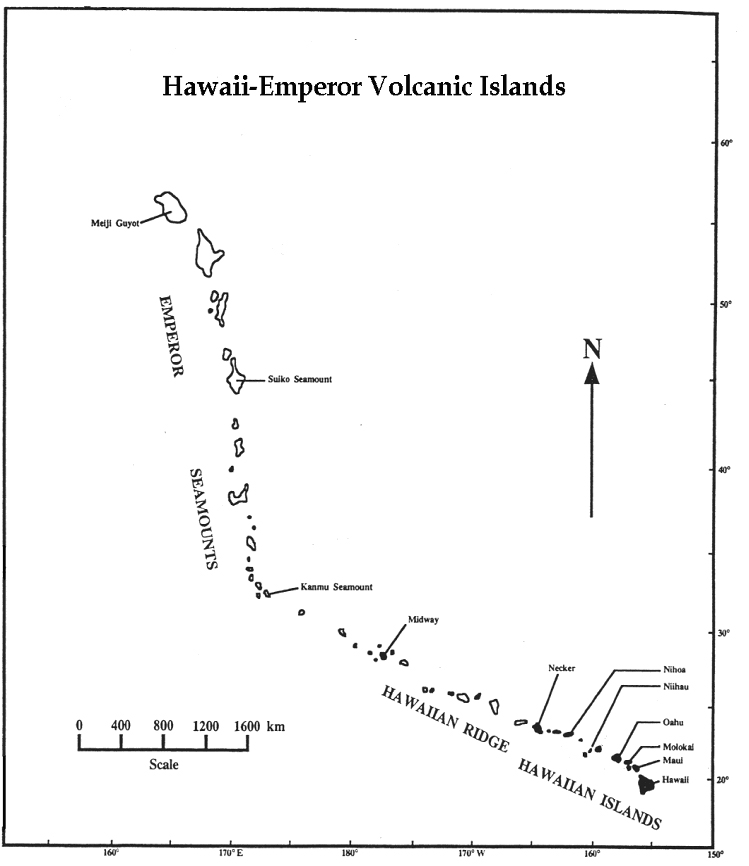
Table: Age vs. Location of Hawaii-Emperor Volcanic Islands
| Island/Seamount |
Distance from Hawaii Island Along Chain (in kilometers) |
Age (in millions of years) |
| Hawaii | 0 | 0 |
| Maui | 200 | 0.84 |
| Molokai | 320 | 1.48 |
| Oahu | 400 | 2.55 |
| Niihau | 680 | 3.0 |
| Nihoa | 920 | 3.5 |
| Necker | 1200 | 9.5 |
| Midway | 2800 | 17.9 |
| Kanmu | 4000 | 37.5 |
| Suiko | 6000 | 41.8 |
| Meiji | 7400 | 67.0 |
Calculation Tips
You are asked to determine the velocity of Pacific Plate motion. Keep in mind that most tectonic plates move about 10 centimeters in one year, or 10 cm/yr. Much faster would be very disturbing!
Recall that Velocity is a measure of how much time (expressed at milliseconds, minutes, hours, etc.) it takes to move a certain distance (expressed as microns, kilometers, miles, etc.). For example, the velocity of a car is usually expressed in kilometers per hour, or km/hr, or kph. If you set up your graph with Distance on the Y-axis and Time/Age on the X-axis, then the Slope (Rise/Run or Y-axis/X-axis) is also an expression of Velocity.
Velocity = Distance/Time
You are given data on the Pacific Plate in Time units of millions of years (my) and Distance units of kilometers (km). You will have to convert these units to years and centimeters in order to get a meaningful answer about the velocity of Pacific Plate motion. Using the information provided in its unconverted form would give you an answer in kilometers per million years, which does not help much in making shorter-term decisions.
Step 1. Conversion of units
Kilometers to centimeters:
How many meters in a kilometer? _______________ How many centimeters in a meter?__________________
Multiply your answers to get how many centimeters there are in a kilometer. ___________________________
Millions of years to years:
How many years in a million years?_________________________________
Hint: Look at the prefix. What do kilo- and centi- signify?
Step 2. Setting up the equation
Insert your new units of Time (year) and Distance (cm) into the Velocity equation.
Hint: Whenever you are dealing with an equation that involves many zeros on the top and bottom you may want to cancel some of them to make calculation a little less troublesome.
The rules for canceling are simple.
1. Cancel exactly as many zeros from the top as you do the bottom.
2. The position of the decimal place matters! Only cancel zeros from the top and bottom that are on the same side of the decimal point.
Step 3. Solving the equation
This now becomes nothing more than a simple division problem. Solve it as you would any other division problem. If you set it up properly, you should not even have to use a calculator! Round your answer to one decimal point.
Overhead transparency: Pacific Plate
Click on image for full sized map
![]()

![]()